The Observation Map tool allows visualization of data in the AKN. Available data are those shared at Level 2 or above in the AKN, in addition to 10 years of eBird and Breeding Bird Survey data. See the full list and descriptions of available data sets.
You can use the Observations Map to explore data by species or geographic areas by following the instructions below.
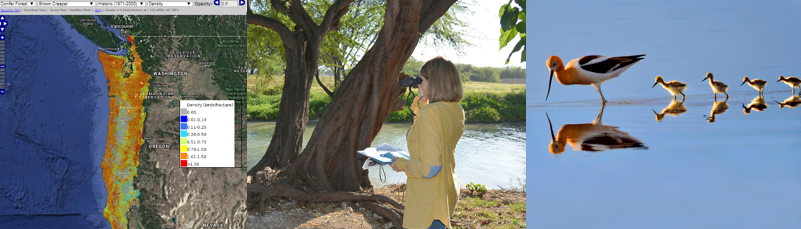
- Select a species from the species dropdown.
- Select one or more data collections and watch points load on the map where the species was observed (this may take a moment). You can click on a point to view a summary of observations associated with that one point (make sure you select the point and not the area outside the point), or you can use the “draw a shape” tool at the top center of the map to draw a polygon to see results for multiple points.
- Select a map overlay, and then click within a region of the overlay outside of a point to get the regional summary for your species. This regional summary also contains all other species that were observed in that region for the data collections selected.
- To view data by region for all species and data collections, select the first option in the species dropdown “Select a Species”. This will disable the individual species and dataset selection options, and disable display of individual observation points. Select an overlay of choice, and then click within the region of the overlay for which you’d like a summary.
You may also:
- Narrow your range of months (if desired) using the month filters.
- Use the controls to zoom in on an area of interest; or enter a county, city, or street address in the address search bar to zoom to a particular location.
- If multiple years are displayed above the results, click on individual years to view results by year.
- Download your results to a CSV by the clicking on the “CSV” link at the bottom of the results.
- Collapse and expand the help and data query panels by clicking on the left edge of the panel.